
A microarray experiment produces a matrix with thousands of rows (the genes measured) and a few dozen columns (the samples): the familiar «p far larger than n» regime, the one where most statistical methods — built for the opposite case — stop working well. For about two years R has been the tool with which a growing number of laboratories tackle this regime, and from this year the Bioconductor project has tried to give those laboratories a common infrastructure in place of isolated scripts.
Background
R is a free implementation of the S language from Bell Labs. Ross Ihaka and Robert Gentleman started it in 1993 at the University of Auckland, and the R Core group distributes it under the GNU General Public License. Version 1.0 dates from February 2000; the current release is 1.3.1, from the summer of 2001. Add-on packages come through CRAN, the Comprehensive R Archive Network.
Three properties of the language weigh on anyone working with biological data. First: the data.frame and the atomic vector are native types, not structures to be emulated on top of generic lists and dictionaries. Second: the model formula. Writing lm(y ~ treatment + batch) describes a linear model in the same notation a statistician would use on paper, and the ~ syntax extends to generalised linear models and to mixed-effects models. Third: the numerical kernel is written in C and Fortran, and the heavy methods — linear algebra, optimisation — call into LAPACK. So the interpreter’s cost falls on the orchestration code, not on the inner loops.
The domain where all this became pressing is gene expression. Affymetrix oligonucleotide platforms and two-colour spotted arrays have made the simultaneous measurement of thousands of transcripts routine. The work of Alizadeh and colleagues on diffuse large B-cell lymphoma, published in Nature in 2000, shows that the expression profile separates two forms of the disease with different prognosis: one of the first cases in which a microarray leads to a clinically relevant subtyping rather than a plain list of interesting genes. Comparable results are appearing in breast, colon and the leukaemias.
The technical problem
Analysis does not start with the statistical tests but with the raw data, and that is where most of the errors hide. An Affymetrix chip does not measure a gene once: each transcript is interrogated by a perfect match probe and a mismatch probe differing by one nucleotide, and the two values have to be combined and corrected for background signal before one reaches an abundance estimate. From one array to the next, the overall intensities then shift for purely technical reasons — RNA quantity, hybridisation efficiency, reagent batch — and comparing samples without normalising means measuring the experiment instead of the biology.
These are the steps where open source weighs more than elsewhere. If the background-correction and normalisation pipeline is a closed box, two laboratories using the same commercial instrument can obtain different lists of differential genes with no way to work out why. With R the correction code can be inspected and version-controlled, and a reviewer can rerun the script against the deposited data. The migration of microarray methods towards an open language has a technical reason before an ideological one.
What Bioconductor standardises
Bioconductor, started in 2001 and coordinated by Robert Gentleman, introduces no new statistical method: it tries to get the packages to agree on how they represent an experiment. The central piece is the Biobase package, which defines a single structure to hold together three tables that until now each script kept separate: the expression matrix, the sample metadata (phenotype, treatment group, clinical data) and the probe annotation. In one object, selecting a subset of samples realigns the matrix and the metadata by itself, and a whole class of index-misalignment errors — easy to introduce by hand — disappears.
On this base the application packages under development are built: affy reads the CEL and CDF files of Affymetrix platforms and applies background correction and normalisation; marray works on two-colour arrays; and a set of annotation packages maps probe identifiers onto UniGene, GenBank and LocusLink. This last point makes less of a show than the statistical computation, but it counts just as much: a list of differential probes says nothing until you link it to genes and functions, and the annotation ages as the sequence databases are updated.
The release model is the other half of the project. Instead of packages each evolving on its own, Bioconductor aims at coordinated releases: the packages of a given date are tested together, against the same version of R and of the annotation archives. The first official release, 1.0, is expected during 2002, with a description of the project in the peer-reviewed literature.
Implications
For a European biomedical research group, including a small Italian one, the immediate effect is licence-free access to the same techniques used by the groups that sign the reference work. The firmer technical point, though, concerns reproducibility: when the analysis pipeline is a version-controlled R script and the raw data are deposited, the analysis becomes rerunnable by third parties. Some journals are already starting to ask for code and data as a condition for publishing.
Bioconductor grows alongside other open-source projects for computational biology maturing in the same months: BioPerl, BioJava at its first release this year, BioPython under development. The centre of gravity differs. Those projects bring bioinformatics into general-purpose languages; R starts from a language in which the syntax of statistical models is already that of the domain.
Limits
Three concrete constraints remain. The first: R keeps its data in memory, and an expression matrix of many arrays against tens of thousands of probes can exhaust the RAM of a 2001 workstation. Sizing is a real problem, not a detail. The second is statistical: with thousands of simultaneous tests, controlling false positives is not trivial, and the methods for multiple testing at this scale are still settling. A tidy package does not make a badly designed analysis correct. The third is regulatory: for phase III clinical trials and documentation for the FDA and EMEA the reference platform remains SAS, validated for that use, and the qualification of R in regulated settings is still an open discussion rather than established practice.
The factor to watch over the coming months is the quality of the core packages — affy and the annotation infrastructure above all — and whether the coordinated-release model holds. These, more than the availability of statistical methods, will decide whether Bioconductor becomes the standard environment for clinical molecular data or stays an academic tool.
- https://www.r-project.org/
- https://cran.r-project.org/
- https://www.bioconductor.org/
- https://www.nature.com/articles/35000501
- https://www.noze.it/en/insights/r-bioconductor-bioinformatica/
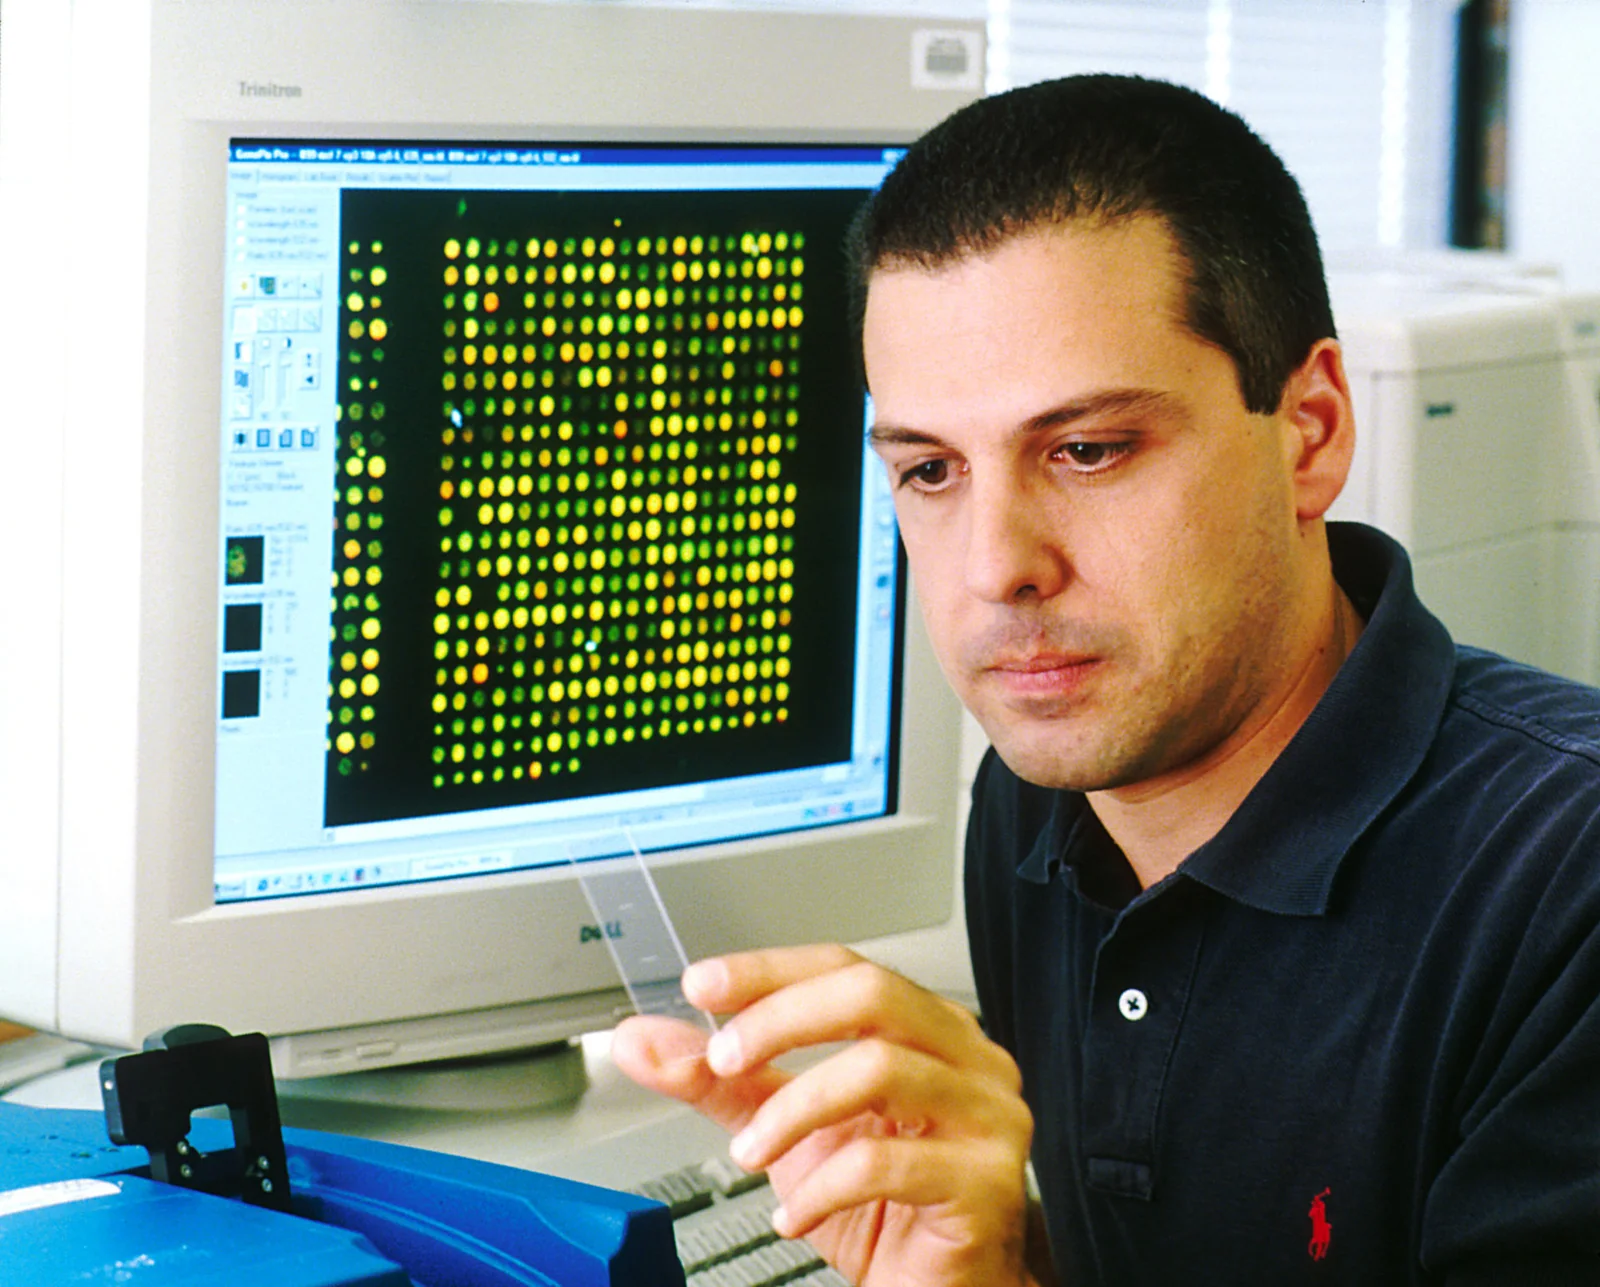
Cover image: Laboratory technician seated at a computer whose screen displays the coloured grid of a DNA microarray — photo by Bill Branson, public domain — https://commons.wikimedia.org/wiki/File:Microarray.jpg