
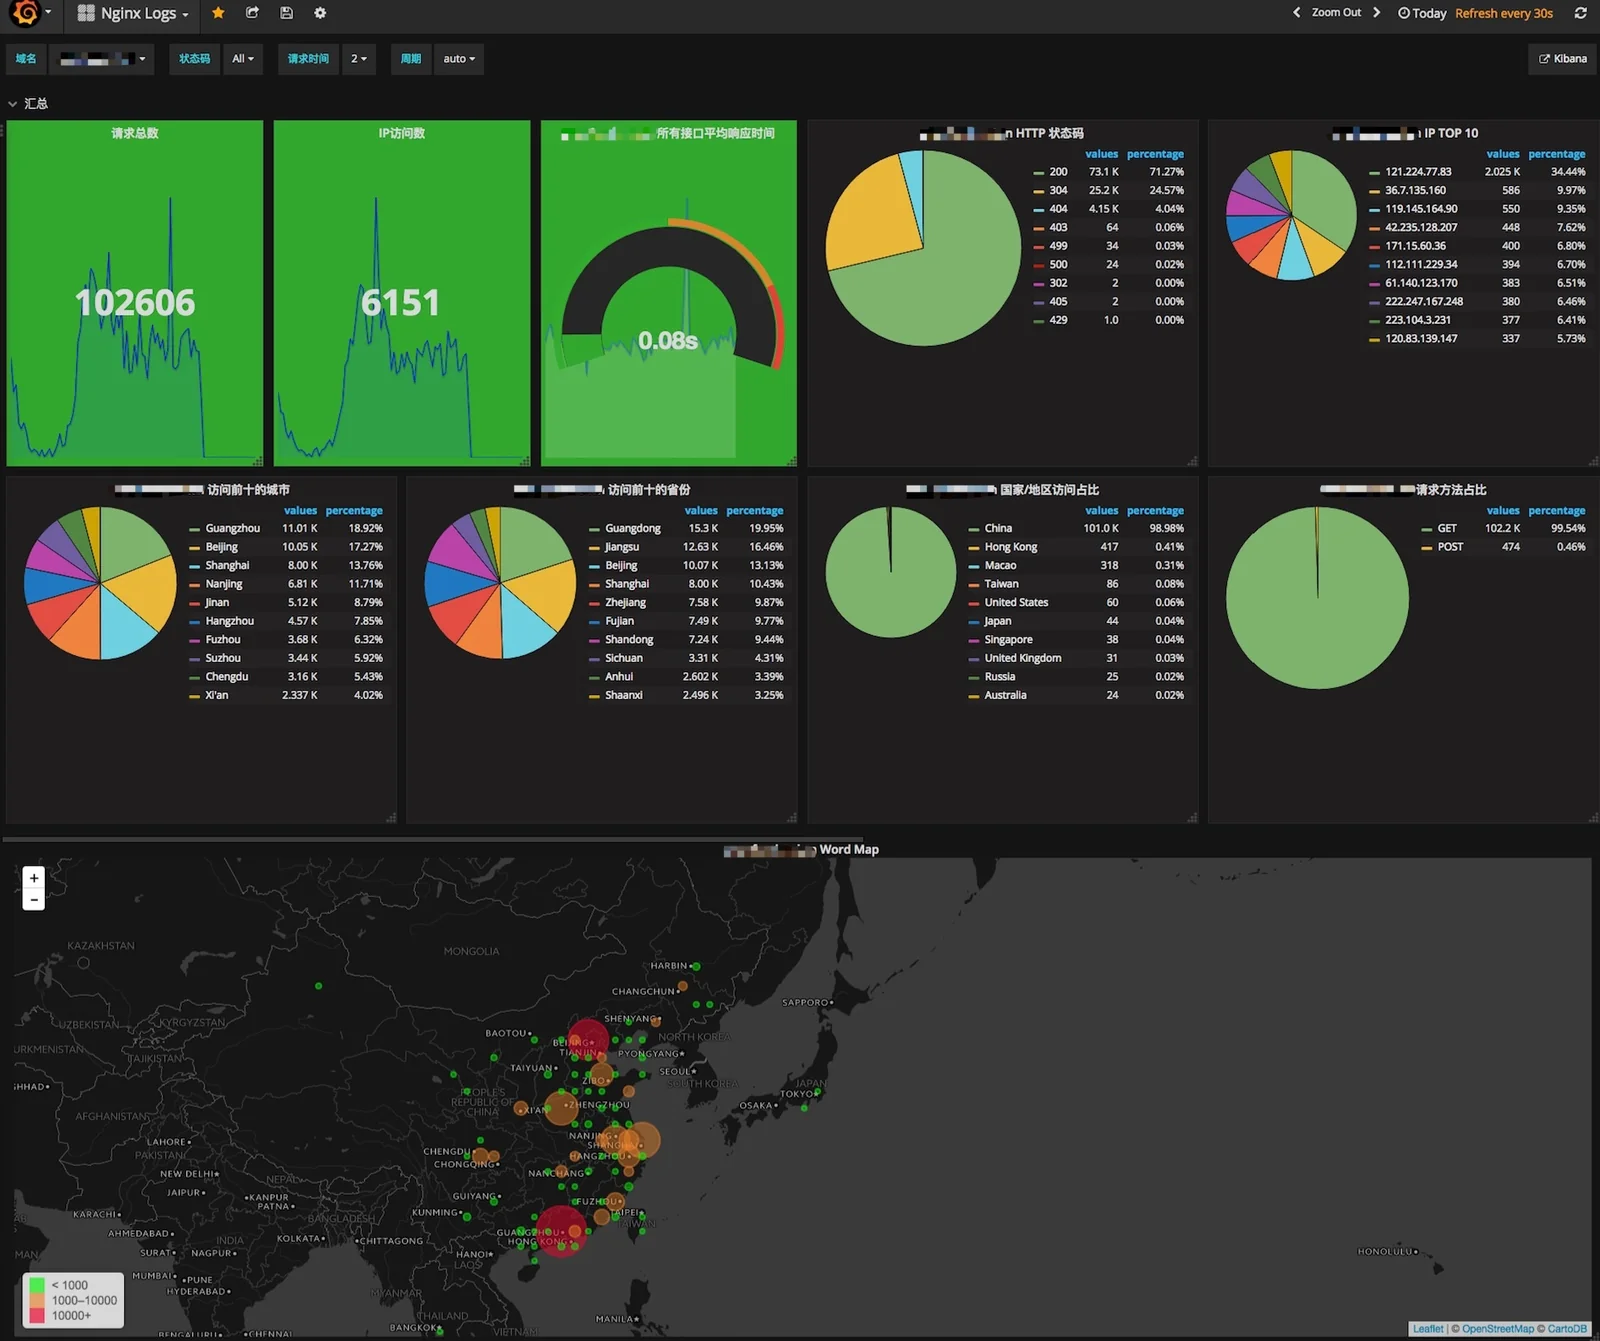
Grafana is a visualisation server with no metric storage of its own: each panel queries an external source on the fly — Graphite, Prometheus, InfluxDB, Elasticsearch, OpenTSDB — and draws the reply. This architectural choice, there from the earliest releases, keeps the problem of storing time series apart from that of showing them, and it explains why a single dashboard can mix data coming from different backends.
Context
The project started in 2014 as a fork of the Kibana 3 interface. Torkel Ödegaard wrote it out of his own work on rendering time series with Graphite. The technical motivation, documented, is that Kibana at the time stayed tied to the Elasticsearch backend and was not meant to query generic TSDBs. Grafana inherited that interface’s grid-of-panels layout and reoriented it around a single abstraction: the query against a metric source.
The code ships under the Apache 2.0 licence, a permissive one: it allows use, modification and redistribution even inside closed products, with no obligation to release the derivative. It weighed on adoption: many organisations put Grafana inside internal stacks without having to worry about copyleft constraints.
Architecture
The central element is the data source plugin. A data source is a module that translates a panel’s request — a time range, one or more query expressions, a resolution — into the source’s native protocol, and normalises the reply into (timestamp, value) series that the frontend can draw. Grafana’s backend acts as a proxy towards the source; the browser almost never talks to the TSDB directly.
Above the data source sit three stable abstractions:
- the dashboard, described in full by a versionable JSON document that holds the panel layout on the grid, the queries and the rendering options;
- the panel, the unit of visualisation (line graph, gauge, table, heatmap) bound to one or more queries against one or more data sources;
- the template variable, a placeholder resolved at runtime — usually with a query to the source — that lets a single dashboard serve different environments, services or hosts through drop-down menus.
Because the dashboard is self-contained JSON, you export it, version it in a repository and rebuild it elsewhere: the dashboard becomes a configuration artefact, not opaque state inside the application.
With the query at the centre, each panel can point at a different source. On the same screen you can have an application series from Prometheus, an infrastructure counter from Graphite and a SQL query against PostgreSQL, because each panel resolves its own request independently, through its respective plugin.
The critical point
The clean split between storage and visualisation is also the most visible limitation, and version 4.0 — stable since December 2016 — makes it explicit by bringing alerting into the core. As long as Grafana merely queries at request time, it holds no state of its own about the metrics: every graph comes from an ephemeral query. Alerting breaks that property, because evaluating a threshold rule requires that something run that query at regular intervals, continuously, whether or not a browser is watching.
That evaluation ended up in grafana-server, the backend, not in the frontend. A rule is defined on the existing graph panel by dragging the threshold onto the axis; from then on the server re-evaluates it at intervals, holds the alert state (ok, alerting, no_data) and sends notifications to the configured channels — Slack, PagerDuty, email, webhook — whenever the condition changes.
The technical constraint is that server-side evaluation has to know how to run the query without the frontend’s rendering, and this does not hold for every plugin in the same way. In 4.0, alerting works on those sources whose query model runs in the backend — Graphite, Prometheus, InfluxDB, OpenTSDB — while the others stay out. It is the price of having kept the two planes apart for years: adding persistent state about the metrics forces some of the query logic, which earlier lived only in the drawing of the graph, back into the server.
Implications
Treating the dashboard as JSON has practical effects that go beyond portability. A dashboard can live in a repository next to the code of the service it describes, go through code review and follow the same release cycle as the application. Annotations — markers overlaid on the graphs to flag deploys, incidents or configuration changes — close the loop on the operational side: they correlate at a glance a jump in a metric with the event that caused it, without leaving the same screen.
The decoupling also pays off over the long run: changing the collection backend — migrating from Graphite to Prometheus, say — does not force you to rewrite dashboards from scratch, but to rewrite the panels’ queries while leaving the structure intact. The visualisation outlives the source.
Limits
A few constraints are worth keeping in mind. Grafana neither interpolates nor reconstructs data: if the source does not hold a series at a given resolution, no panel makes it up, and the quality of the graph depends entirely on the retention and granularity of the underlying TSDB. It is not a collection system: upstream you still need an agent or a metric exposure, because Grafana takes for granted that the data already exists somewhere. And the 4.0 alerting, evaluated in grafana-server, is a single place where the rules run: its availability and its evaluation frequency become a factor to size, especially as the rules grow in number.
The strength of the uniform-query abstraction is paid for when a source exposes functions that do not normalise into a common model: there the panel shows what the plugin can translate, not the whole range of the native query language.
- https://grafana.com/blog/2016/12/12/grafana-4.0-stable-release/
- https://grafana.com/blog/2016/11/09/grafana-4.0-beta-release/
- https://en.wikipedia.org/wiki/Grafana
- https://www.apache.org/licenses/LICENSE-2.0
- https://www.noze.it/en/insights/grafana-open-source/
Cover image: Screenshot of a Grafana dashboard showing multiple panels on a dark grid with time-series line charts — screenshot by Shiunu, CC BY-SA 4.0 — https://commons.wikimedia.org/wiki/File:Grafana_Dashboard_(2017).jpg