
In an automated clinical laboratory the predictive model is the least-constrained part of the whole chain: the real constraints sit in the protocols by which data reaches it and leaves it. I worked on the cloud engineering of a diagnostic pipeline for a Total Laboratory Automation (TLA) system, and the time spent on the data architecture exceeded the time spent on the model by an order of magnitude.
Context
A TLA system links pre-analytical modules, analysers and post-analytical modules along a physical track that moves the sample tubes. The automation system (LAS, Laboratory Automation System) talks to the laboratory information system (LIS) and to the analysers through a handful of settled standards: CLSI LIS01-A2 for low-level transport, CLSI LIS02-A2 — the revision of ASTM E1394-97 — for the record-oriented message format, and HL7 v2.x (specifically chapter 13, Clinical Laboratory Automation) for the LAS–LIS integration. These standards were born to exchange orders, tube states and structured results, not to deliver the feature vector a machine-learning model expects.
Placing a prediction into this flow therefore means two distinct things: deriving a coherent model input from the messages, and feeding the output back in a format the LIS reads as an ordinary result, with the same traceability as an instrument reading.
Architecture
The pipeline has four decoupled stages: data collecting, pre-processing, post-processing, delivery. The model lives only between the second and the third. The decoupling is not a cosmetic choice: it serves to version pre-processing separately from the model, a requirement so that the same raw input can be re-processed when the model changes.
- Data collecting: incoming LIS02-A2 records and HL7 messages from the analysers and the middleware are normalised into a stable internal schema. This is where most of the non-automatable work concentrates: every analyser implements the standard its own way (optional fields, local analyte encodings, record ordering), and the pipeline has to absorb these variations without propagating them downstream.
- Pre-processing: validation, handling of missing values, construction of the feature vector. The stage writes the exact input passed to the model, not just the result: without the stored input a prediction is not reproducible.
- Post-processing: the model output (a score with its confidence level) is correlated with the other results of the same tube and qualified. A prediction without metadata on the model version and the confidence window is of no use to whoever signs off the report.
- Delivery: the result returns to downstream systems in the same format as instrument results, so that the LIS does not distinguish, at the transport level, a measurement from a prediction — while still being able to distinguish them semantically.
The infrastructure is containerised with Docker and runs both in the cloud and on-premise. In many laboratories the on-premise constraint is not up for discussion: a sample’s data does not necessarily leave the hospital perimeter, and the architecture has to treat the cloud as a deployment configuration, not as a dependency.
The critical point
The constraint that orders the whole design is the latency the track allows. In a TLA system the tube is in motion, and a result has to come out within the window in which the sample can still be routed downstream. An inference that arrives late is as useless as a wrong one: the system must degrade predictably, that is, keep the physical flow going even when the prediction is missing, and never stall the track waiting on the model.
From this comes the rule that guided the implementation choices: the prediction is an extra result, with its own time budget, not a mandatory step in the chain. Delivery is decoupled from inference through a queue; if the model does not answer within the budget, the sample is reported all the same with the instrument results alone, and a late prediction is discarded or logged as out-of-window. This moves part of the complexity from the model to the orchestration, and it is the part of the work that weighs most on the system’s perceived reliability.
Implications
Fine-tuning a prediction model on real clinical datasets — optimising sensitivity and specificity — is a real but bounded problem: it is measured on a test set and iterated. The problem that does not close the same way is post-deployment monitoring. The input distribution shifts: the analyser fleet changes, reagent lots change, the patient population changes. Without a continuous measure of the gap between the training distribution and the operating one (data drift), the metrics declared at acceptance describe a system that no longer exists after a few months. The literature on deploying models in health care converges here: external validation and continuous monitoring are requirements, not options, and the pipeline has to keep enough context to reconstruct, after the fact, how a given prediction was arrived at.
There is then the regulatory constraint. Since 26 May 2022 Regulation (EU) 2017/746 (IVDR) has been fully applicable, and software contributing to a diagnostic purpose may fall under the definition of an in-vitro diagnostic medical device, with the risk classification of Annex VIII. This is not a downstream administrative detail: it shapes the architecture, because it requires tracing the model version and the data it operated on, and so makes the persistence of inputs and metadata a property that cannot be removed from the pipeline.
Limits
None of this says whether the model is clinically useful: integrating a mediocre model well yields mediocre predictions delivered reliably. The clean separation between model quality and integration quality holds as long as pre-processing is stable; when the feature vector depends on choices the model itself induces, the two planes intertwine and the decoupling described has to be renegotiated. Finally, the robustness of the orchestration described is verified against the anticipated failure modes — timeouts, malformed messages, a non-standard analyser — and not against those that prolonged operation will surface and that, by definition, have not yet been observed.
The INPECO work — fine-tuning the diagnostic model and engineering the cloud platform — is documented in the noze insight: https://www.noze.it/en/insights/inpeco-diagnostic-ai-cloud/.
- https://www.inpeco.com/
- https://www.hl7.eu/HL7v2x/v251/std251/ch13.html
- https://eur-lex.europa.eu/eli/reg/2017/746/oj
- https://en.wikipedia.org/wiki/Regulation_(EU)_2017/746
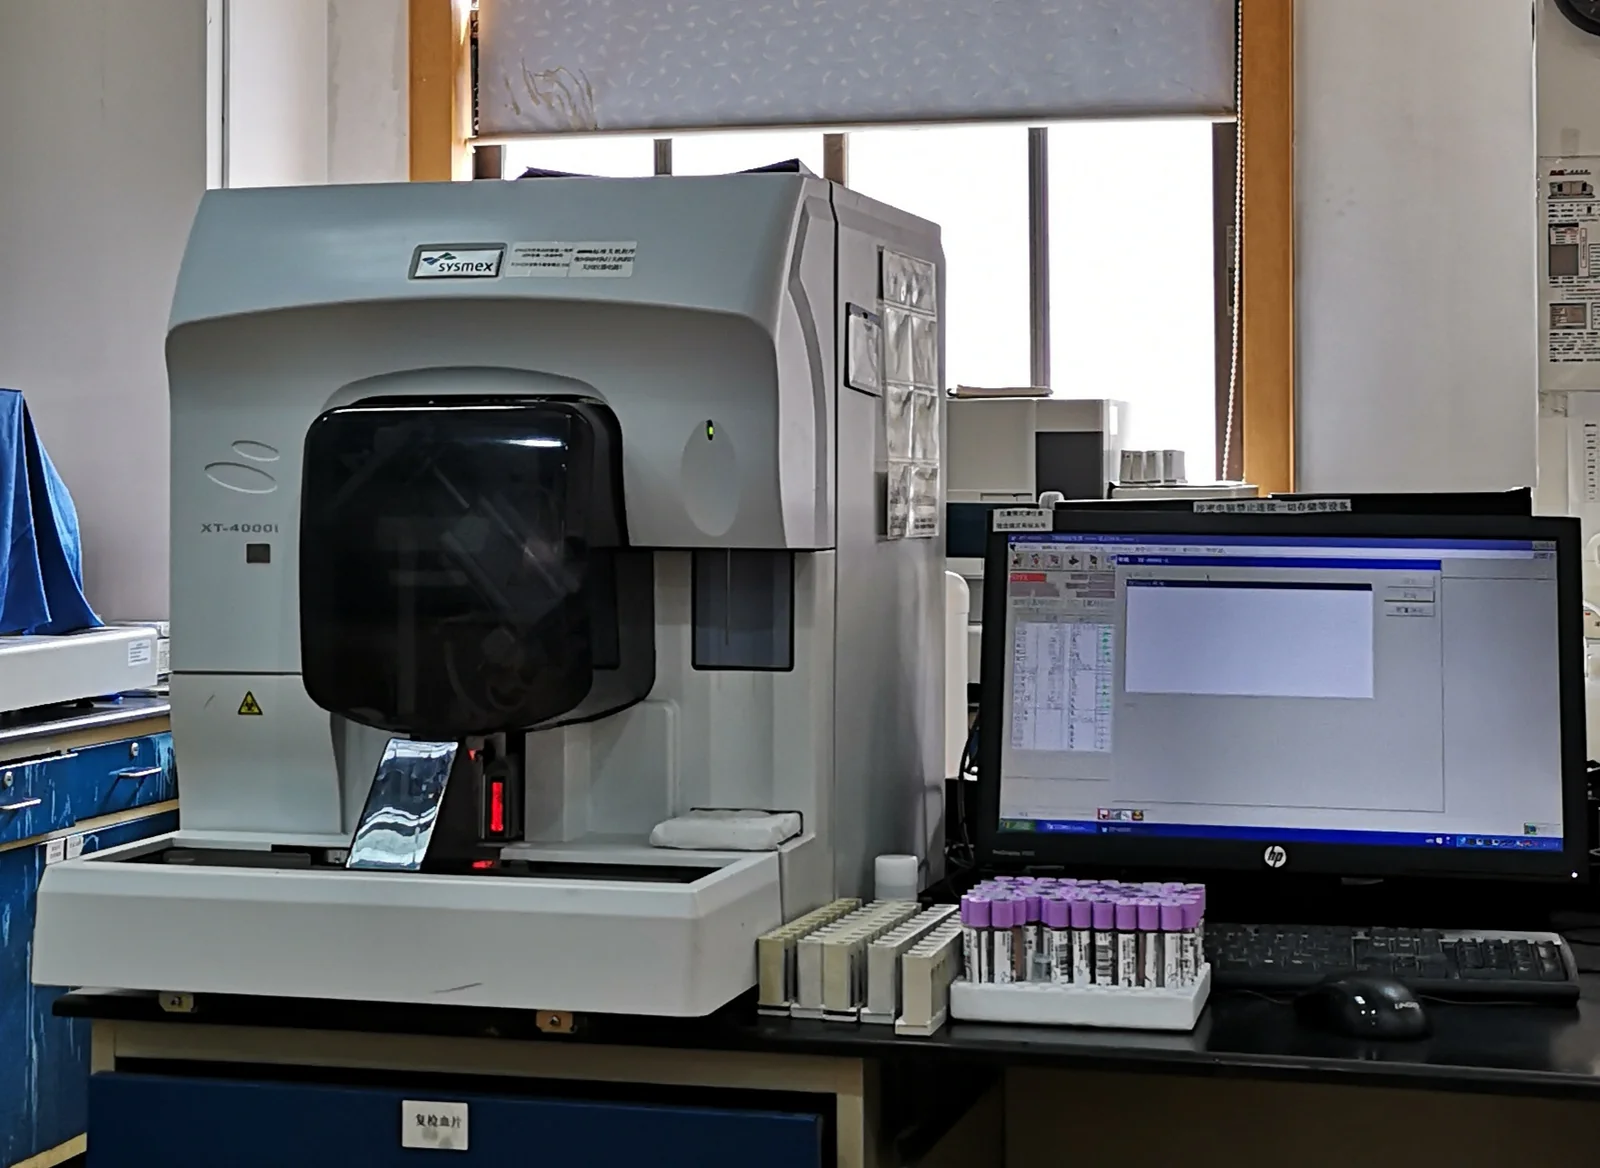
Cover image: Clinical hematology analyzer with purple-capped blood sample tubes racked for loading, an active barcode reader, and the laboratory… — photo by Ptrump16, CC BY-SA 4.0 — https://commons.wikimedia.org/wiki/File:Sysmex_XT-4000i.jpg