
At KubeCon + CloudNativeCon in Seattle, on 11 December 2018, Grafana Labs announced Loki: an alpha-stage log aggregator that indexes only a set of labels per stream, not the text of the lines. The project is written in Go, released under the Apache 2.0 licence, and the code sits at github.com/grafana/loki.
Context
In 2018 the most common logging stack revolves around Elasticsearch: an agent (Filebeat, Fluentd) ships the lines, Logstash or an equivalent pipeline processes them, and Elasticsearch builds an inverted index on every term. The full-text index makes arbitrary searches over the text possible, but you pay for it: every token becomes an entry in the index, and the index wants fast disk and memory. On the volume of application logs in a Kubernetes cluster the ratio between index size and raw data size tends to grow, and with it the hunger for RAM and SSD.
Tom Wilkie and David Kaltschmidt, who wrote the first design document in March 2018, start from an operational observation: in many workflows nobody searches for some arbitrary word across all the logs in the cluster. You start from a known service — a namespace, a pod, an application — and within that subset you filter with something resembling grep. If logs are already consulted this way, indexing every token is work paid for and never used.
Architecture
Loki reuses the machinery of Cortex, the horizontally scalable Prometheus implementation Wilkie has worked on. Lines arrive via push — the opposite of Prometheus’s pull model — and pass through three components.
The distributor receives the HTTP requests carrying the streams and the lines. From each stream it computes a hash out of its labels and, through a consistent hash ring, finds the destination ingester. With a replication factor greater than one, the same stream lands on several ingesters.
The ingester gathers the lines of a stream in memory into a chunk, compresses it, and every so often flushes it to long-term storage. Compression works well because the lines of a single stream resemble one another.
The querier runs the queries. A query has two parts: a label selector — the same syntax as Prometheus matchers, for instance {app="webapp", env="prod"} — and an optional text filter applied to the lines of the selected stream. The querier asks the ingesters for data still in memory and the storage for the chunks already flushed.
Storage is split in two. An index holds the mapping between labels and chunks; in the early versions it lives on a NoSQL store — DynamoDB, Google Bigtable or Cassandra. The compressed chunks, that is the actual content of the logs, sit on object storage: S3, Google Cloud Storage or a compatible equivalent. The index stays small because it holds only labels, and among the tiers named here object storage is the cheapest.
On the collection side, the reference agent is Promtail: it discovers the targets — files, journald, Kubernetes pods — derives the labels from the metadata (for pods, the labels already present) and ships the lines to the distributor. The log labels come from the same labels Prometheus uses for metrics, so inside Grafana the two sources compare directly.
The critical point
The trade-off is stated, and it should be weighed before adopting Loki: without a full-text index, a text filter is a linear scan of the lines in the selected stream, not a lookup against an inverted index. It stays cheap as long as the label selector narrows down enough the lines to walk through. A query {namespace="x"} with a filter on a rare string is fast if namespace="x" isolates few streams; it gets expensive if the labels grab a wide slice of the cluster and the filter has to walk through gigabytes of lines.
From this follows an operational design constraint: label cardinality must be kept low. Promoting a high-cardinality field to a label — a request identifier, a client IP — generates a flood of distinct streams, each with its own chunk; the same modelling mistake that in Prometheus blows up the number of time series. Labels are there to break logs into a few stable sets, not to replace search over the content.
Implications
The model shifts the cost from storage to query time. Elasticsearch pays upfront — large index, fast hardware — to make every search quick. Loki pays little on write and storage, and pays the individual query in scanning, the more so the worse the label selector narrowed the field. For a team that reaches its logs by always starting from the service and then filtering, the sums work out in Loki’s favour; for one that searches across the text of every log, they do not.
The continuity with Prometheus is the most concrete part operationally. The same labels describe metrics and logs; in Grafana you move from a metrics graph to the log lines of the same service, over the same interval, without reconciling two different naming systems. Anyone already running Prometheus finds almost the same mental model.
Limits
As of January 2019 Loki is declared alpha by its own authors: storage format, query syntax and interfaces may change, and it is not something to put into production on critical logs without reservations. The query language is still elementary — label selector plus text filter — and lacks the aggregations a PromQL offers over metrics. There is no settled record of operation at large scale: the figures on cost relative to Elasticsearch should be measured against one’s own label and query profile, not taken for granted. And the cardinality constraint is not a tuning detail but a requirement: a wrong label model cancels the cost advantage that is the very reason for the project.
- https://github.com/grafana/loki
- https://grafana.com/blog/2018/12/12/loki-prometheus-inspired-open-source-logging-for-cloud-natives/
- https://docs.google.com/document/d/11tjK_lvp1-SVsFZjgOTr1vV3-q6vBAsZYIQ5ZeYBkyM/view
- https://github.com/cortexproject/cortex
- https://www.noze.it/en/insights/loki-grafana/
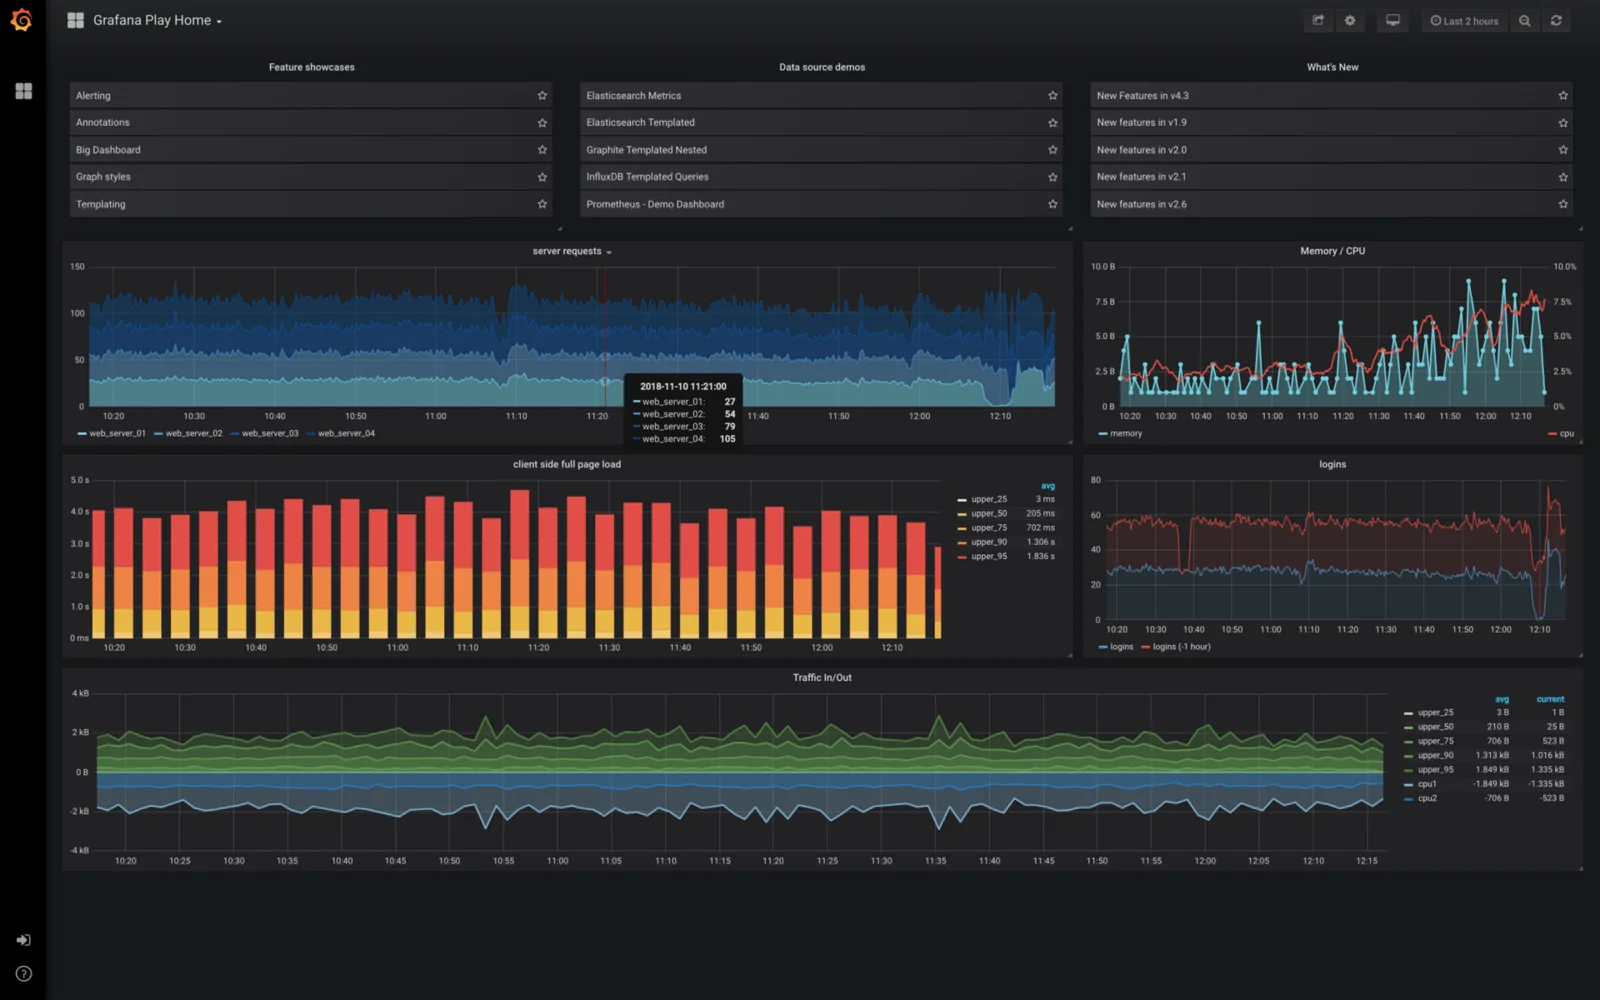
Cover image: Screenshot of a 2018 Grafana dashboard on a dark background showing metric panels: line charts, gauges and time-series graphs — screenshot by Joel Kennedy, public domain — https://commons.wikimedia.org/wiki/File:Grafana_screenshot_(2018).png